Open your T4_Sorts Spreadsheet and re-save it as surname_firstname_T5_Chart.
You are now going to modify your spreadsheet again, this time by adding a Chart to it.
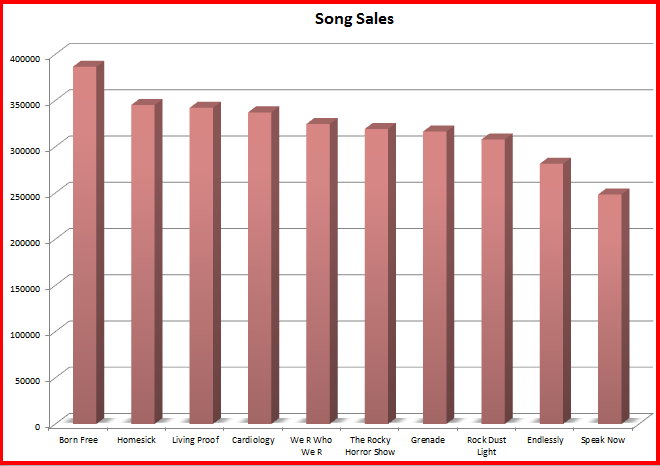
Use the Charts Tool on the Insert Tab to create a Chart similar to the one below.
You may modify the colours if you wish. Save the Chart as a new worksheet rather than in the same worksheet! |